- SHIB Price outlook reveals a bullish bias today.
- Dependable support stands at $0.00002819.
- SHIB’s trading price is $0.00003227.
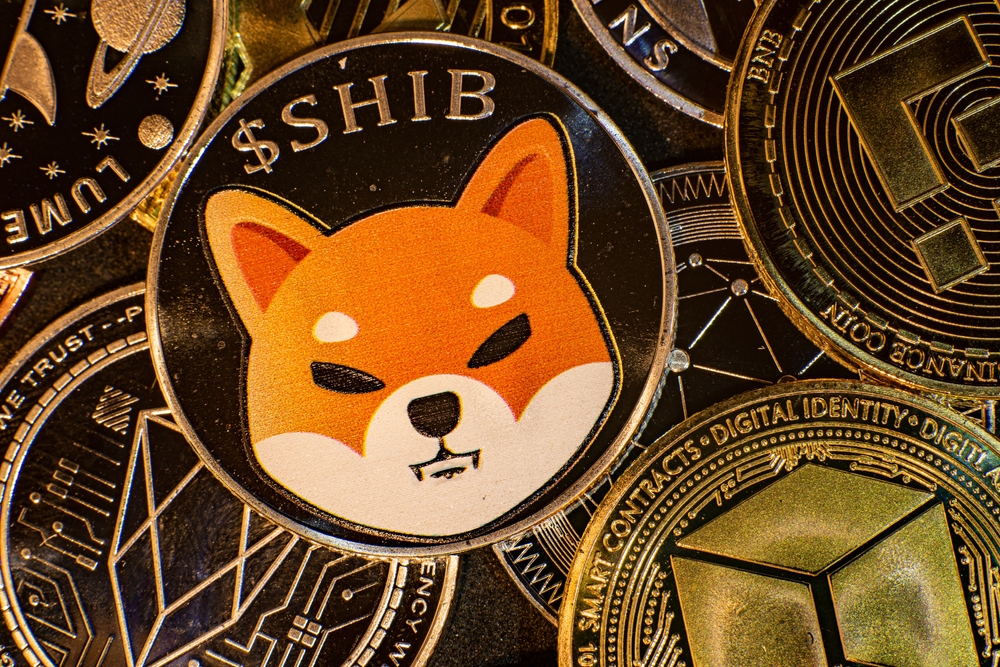
Shiba Inu’s (SHIB) price picture shows the crypto on a substantial bullish market, conquering resistance zones. Bulls appear to keep the meme coin’s optimistic case since last week. For instance, Wednesday’s price action had SHIB increasing significantly to touch $0.00003392 from yesterday’s $0.00003067.
Nevertheless, today’s actions saw Shiba Inu declining to its current levels of $0.00003227, its trading volume standing at 42,142,903,714. However, the coin still trades 3.23% up over the past 24 hours. The Dogecoin competitor ranks 13 in the crypto list by value.
SHIB/USD 4Hr Analysis – Recent Developments
SHIB’s price showed a shaky bullish bias with reducing volatility, making Shiba Inu less price to volatile change. Bollinger’s upper limit stands as a critical resistance at $0.00003528, whereas the band’s lower limit represents SHIB’s support at $0.00002819.
The altcoin’s price seems to cross beyond the MA curve, translating to a bullish market. That way, Shiba Inu jumped into the bullish territory amid massive fluctuations within the past few hours (visible on the chart). The price looks to drop, which might reverse SHIB’s trend.
Meanwhile, the Relative Strength Index score of 63 puts Shiba Inu in the overvalued region, indicating severe inflation signals. Nevertheless, the RSI appears on a downtrend, suggesting a move to stability along with Shiba Inu’s value devaluation. The drop in the Relative Strength Index score reflects dominant sellers.
SHIB/USD 24Hr Analysis
SHIB’s 24hr outlook shows a bullish case. Furthermore, volatility seems to increase, making the alt more vulnerable to volatile changes. Meanwhile, Bollinger’s top border represents support at $0.00003284, while the lower limit band shows another support zone near $0.00001498.
The RSI score at 65 signifies inflation, while the indicator stands in the overbought territory. Nevertheless, the Relative Strength Index seems to follow a downtrend, confirming decreased selling activity.
Conclusion
Shiba Inu follows a bullish trend after the recent uptrend, and bulls are trying to keep the consistency. The token gained increased volatility, opening the room towards either extreme. Nevertheless, the asset’s future depends on bulls’ performance.


